From Prototype to Connected Intelligence
Ratnakar Sahoo’s project represents a clear shift from a standalone environmental-sensing prototype to a connected IoT system with real-world relevance. By integrating cloud capabilities through the FAVORIOT platform, the solution demonstrates how environmental data can move beyond local displays into continuous, remote monitoring.
The system, built on a Raspberry Pi, streams data to the cloud every 15 seconds. This enables real-time visibility and opens the door to analytics, alerts, and decision-making capabilities essential to modern IoT deployments.

A Comprehensive Environmental Monitoring Approach
One of the strongest aspects of this project is the breadth of parameters being monitored. The system captures:
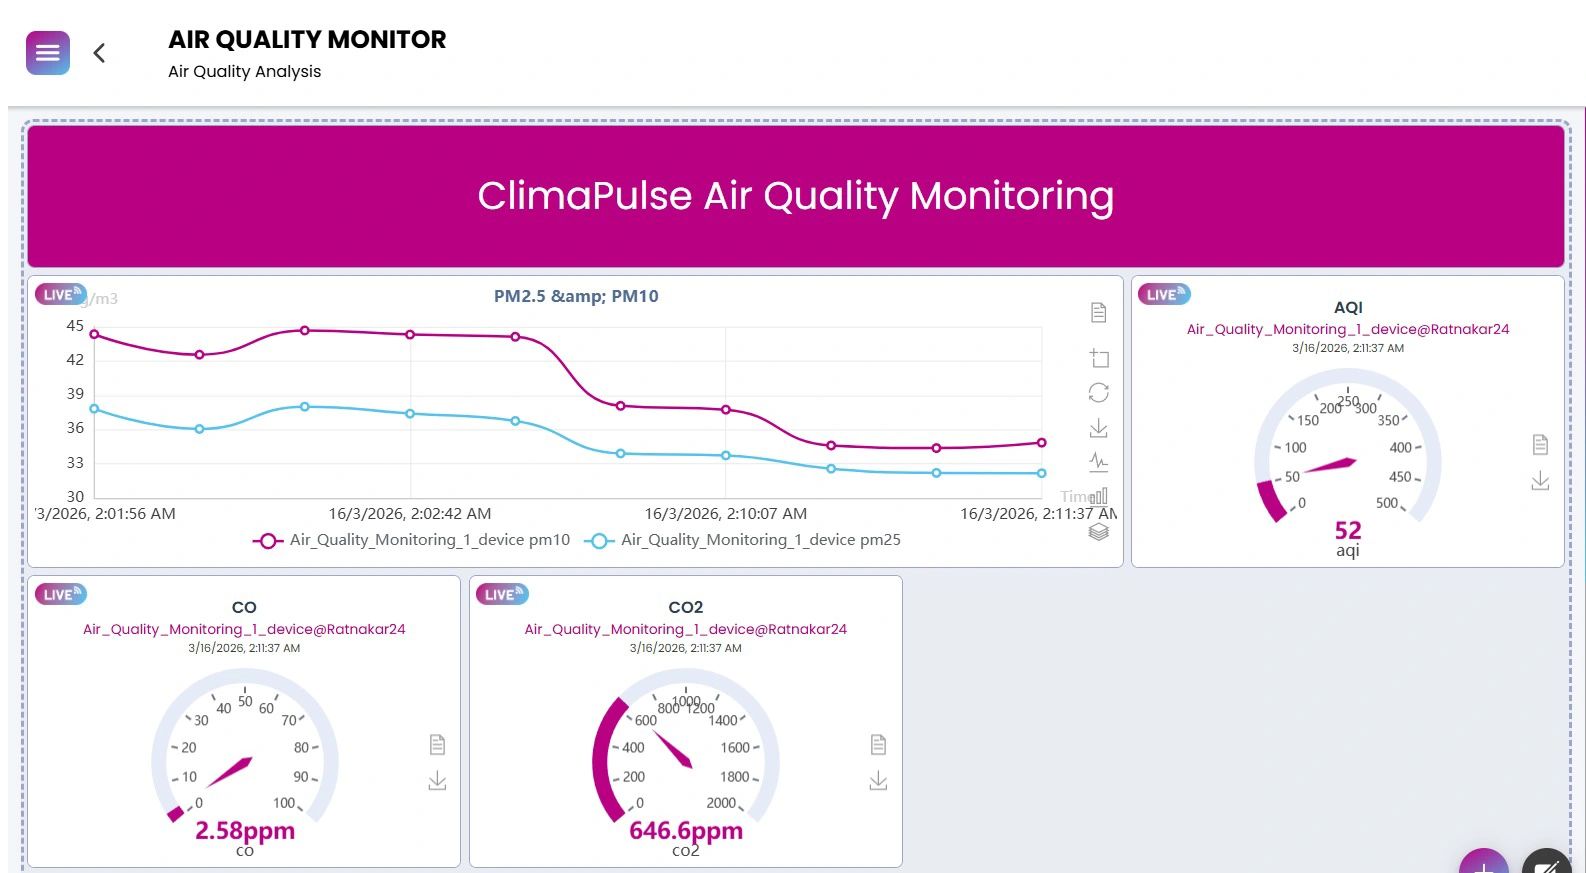
- PM2.5 and PM10 particulate levels
- Gas concentrations including CO₂, CO, CH₄, and NO₂
- Temperature, humidity, and atmospheric pressure
- CPCB-based Air Quality Index (AQI) calculations
This combination provides a holistic picture of the environment rather than isolated measurements. The inclusion of AQI calculations adds context, allowing users to interpret raw sensor data in a meaningful and standardised way.

Turning Data into Visual Insights
Using the FAVORIOT dashboard, the team has developed a live monitoring interface featuring gauges and trend charts. This enables users to visualise environmental conditions instantly from any location.
This step is critical. Many student projects stop at data collection. This project goes further by presenting the data in a way that supports understanding and usability, which is essential for real-world applications.


Strength in System Design and Team Collaboration
The project reflects a solid understanding of IoT architecture, from sensor integration to structured data streaming and cloud connectivity. It also highlights the importance of collaboration, with contributions from the TatvaNova student team playing a key role in refining the system.
Such teamwork often determines whether a project remains a prototype or evolves into something more impactful.
Moving from Monitoring to Action
While the current system provides strong monitoring capabilities, the next step is to introduce intelligence and responsiveness using features available in the FAVORIOT Beginner Plan.
Rule-Based Alerts
Setting thresholds for parameters such as AQI or gas levels allows the system to trigger notifications via Telegram or email. This transforms the system into an early warning tool rather than just a dashboard.
Multi-Node Deployment
Expanding the system to multiple locations can provide comparative insights. Monitoring different zones, such as indoor and outdoor environments, brings the project closer to a smart-city use case.
Historical Data Analysis
With continuous data logging, the system can begin to identify patterns, such as peak pollution periods or correlations among environmental variables. This adds depth to the project by introducing basic analytical insights.
Designing for Scale and Efficiency
As the system grows, proper structuring becomes essential. Organising devices, standardising data streams, and maintaining clear naming conventions will support scalability and maintainability.
Another improvement lies in optimising data transmission. Instead of sending data at fixed intervals continuously, the system can adopt event-based communication. For example, data can be sent more frequently during abnormal conditions and less frequently when the environment is stable.
Introducing Early Predictive Thinking
Even without complex AI models, the system can begin incorporating simple predictive logic. Detecting gradual increases in pollutant levels and triggering early warnings before thresholds are exceeded is a practical way to move toward predictive monitoring.
This represents an important shift from reactive to proactive system design.
From Academic Project to Real-World Potential
This project already demonstrates capabilities that extend beyond academic requirements. With the addition of alerts, multi-node deployment, and basic analytics, it has the potential to evolve into a deployable environmental monitoring solution for campuses, industrial zones, or urban environments.
The key question moving forward is this:
If such systems were deployed at scale, how could real-time environmental data influence decisions made by city planners, facility managers, or public health authorities?
FAVORIOT Resources
- General
- Pricing
- How to Choose the Right Favoriot Plan for Your IoT Project
- Favoriot Ecosystem Plan
- Why Universities Need an IoT Ecosystem, Not Fragmented IoT Accounts
- When IoT Builders Outgrow Dashboards: Why the Favoriot Platform Developer Plan Exists
- Favoriot Launches Lite Plan to Support Students, Beginners, and Early IoT Builders
- Faybee AI – IoT Copilot
- Favoriot Intelligence
- Favoriot Insight Framework
- What is Favoriot Insight Framework (FIF)?
- Favoriot Machine Learning
- Why Favoriot’s ML Infrastructure Reduces Costs
- Why Favoriot’s Built-in Machine Learning Matters for AI Researchers and IoT Developers
- Favoriot’s Rule Engine 2.0: A Structured Approach to IoT Automation
- The Key Differences: Favoriot’s Rule Engine 2.0 and AI Agents
- IoT & AIoT Labs
- Trainings
- Favoriot Partner Network
- Videos (Playlist & Highlights)
- How-To Use Favoriot Platform Playlist
- Favoriot IoT World Playlist
- IoT Deep Dive Playlist
- Favoriot Sembang Santai Playlist
- IoT Deep Dive – Episode 7 (FAVORIOT Insight Framework)
- IoT Deep Dive – Episode 4 (Favoriot Partner Network Solves IoT Fragmentation)
- IoT Deep Dive – Episode 5 (Building IoT Solutions With Favoriot Middleware)
- Favoriot IoT World – Episode 3 (Unboxing the AIoT Lab)
- Favoriot IoT World – Episode 6 (Favoriot AIoT Architecture – Data to Decision)
- Favoriot IoT World – Episode 4 (Favoriot’s IoT Pricing)
- FAVORIOT Projects
- FULL FAVORIOT RESOURCES
- Others

![[Project Challenge #15] Smart Shopping Behaviour Analytics Using the Favoriot Insight Framework (FIF)](https://iotworld.co/wp-content/uploads/2026/03/Project-Challenge-15-Decoding-Precinct-Shopping-Movement-Patterns.png)
![[Project Challenge #14] Smart Parks Powered by the Favoriot Insight Framework](https://iotworld.co/wp-content/uploads/2026/03/Smart-Parking-Data-Integration-Framework.png)

Leave a Reply