![[Project Challenge #8] Smart Pole (Intelligent Pole) for Smart Cities Using the Favoriot Insight Framework](https://iotworld.co/wp-content/uploads/2026/03/Evolution-of-Intelligent-Urban-Lighting.png)
Introduction
Cities never truly sleep. Streets remain alive long after sunset. People walk home, traffic continues to flow, public transport moves through busy intersections, and thousands of daily activities unfold beneath the glow of street lights.
Yet most urban infrastructure still behaves as if the city is silent.
Traditional street poles perform only a single task. They illuminate roads. They do not observe what is happening around them. They cannot detect congestion, identify safety risks, monitor environmental conditions, or support city services.
In a rapidly growing urban environment, this limitation creates a gap between what cities need to know and what they can see.
A Smart Pole changes that equation. When it includes AI, it becomes an “Intelligent Pole“.
By embedding sensors, cameras, and connectivity within existing street infrastructure, a Smart Pole becomes an intelligent urban node. It observes, measures, communicates, and transforms everyday city activity into real operational insights.
However, collecting data alone does not solve urban problems. Cities require a systematic way to transform raw data into meaningful decisions.
This is where the Favoriot Insight Framework becomes essential.
Using the Favoriot Insight Framework, Smart Pole deployments move beyond simple monitoring toward structured intelligence that supports safer streets, more responsive city services, and better long-term urban planning.
The following project challenge demonstrates how Smart Pole systems can be implemented using the Favoriot platform and structured through the layers of the Favoriot Insight Framework.

Layer 0: Intent and Context
Defining the Urban Challenge
The first step in any Smart City project is to clearly define why data must be collected.
Urban street infrastructure sits at the centre of many city challenges. These include safety, traffic management, environmental monitoring, and efficient public service delivery.
Key challenges faced by many cities include:
• Limited real-time visibility of street-level activities
• Slow response to accidents, congestion, or security incidents
• Lack of environmental data, such as air quality or noise levels
• Inefficient street lighting and energy consumption
• Limited data to support urban planning and mobility policies
Smart Poles offer a strategic location to deploy sensing capabilities across a city without building entirely new infrastructure.
A Smart Pole initiative should aim to address the following objectives:
• Improve public safety through continuous monitoring
• Enhance traffic visibility and mobility management
• Monitor environmental conditions such as pollution and noise
• Provide adaptive street lighting based on activity
• Support future smart city services such as public WiFi, emergency alerts, and connected transport
By establishing these goals at the beginning, cities ensure that the data collected serves clear operational and strategic outcomes.
Layer 1: Data Foundation
Capturing Reality Through Connected Infrastructure
Once the objectives are defined, the next step is building a reliable data foundation.
Smart Poles become multi-sensor urban observation points that continuously stream data into the Favoriot IoT platform.
Typical Smart Pole components may include:
Video Analytics Cameras
• Traffic flow monitoring
• Pedestrian movement detection
• Incident detection, such as accidents or road obstructions
• Crowd density monitoring in public areas
IoT Sensors
• Air quality sensors measuring PM2.5, CO2, or pollutants
• Noise level sensors for environmental monitoring
• Temperature and humidity sensors
• Motion sensors to detect pedestrian or vehicle presence
• Light sensors to support adaptive lighting
Additional Smart Pole Capabilities
• Smart LED lighting control
• Public WiFi hotspot integration
• Emergency call buttons
• EV charging integration
• Public announcement systems
All sensor and video analytics outputs can be streamed to the Favoriot platform through standard IoT protocols such as MQTT or HTTP.
Within Favoriot, the system ensures:
• Secure device connectivity
• Reliable real-time telemetry streaming
• Structured time series data storage
• Scalable device management
• Integration with video analytics outputs
Without a strong data foundation, higher-level insights cannot be trusted.
Layer 2: Descriptive Insights
Understanding What Is Happening in the City
With reliable data streaming into the platform, the next step is to create visibility.
Favoriot dashboards transform raw sensor readings and video analytics results into meaningful visual information.
City operators can view real-time dashboards displaying:
• Traffic density across monitored streets
• Pedestrian activity at intersections
• Air quality conditions across urban districts
• Noise levels in busy commercial areas
• Street lighting usage patterns
• Environmental conditions at different times of day
Examples of descriptive dashboards include:
Urban Mobility Dashboard
• Vehicle counts per intersection
• Peak traffic hours
• Pedestrian crossing patterns
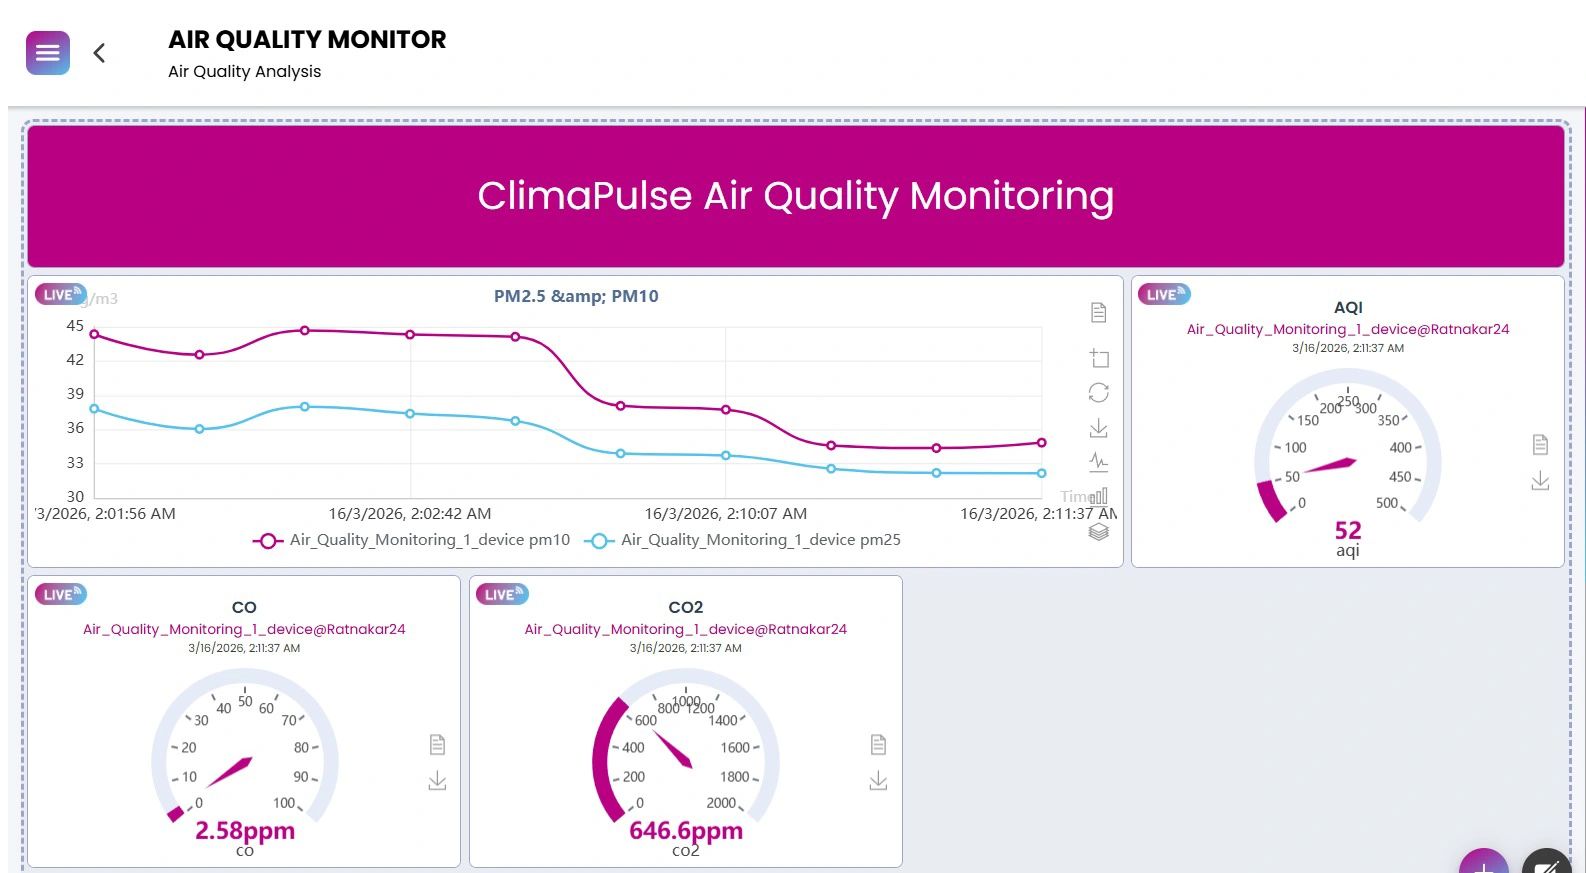
Environmental Monitoring Dashboard
• Air pollution levels by location
• Temperature and humidity trends
• Noise pollution heat maps
Street Infrastructure Dashboard
• Street light operational status
• Power consumption patterns
• Device health monitoring
At this stage, the system answers the fundamental question.
What is happening in the city right now?
City managers gain situational awareness across multiple locations without physically being there.
Layer 3: Diagnostic Insights
Understanding Why Events Occur
Visibility alone is not enough. City operators also need to understand the underlying causes of observed events.
Diagnostic analytics combines multiple data sources to uncover patterns and relationships.
Using Favoriot’s analytics capabilities, Smart Pole data can be analysed across sensors and time periods.
Examples of diagnostic insights include:
• Identifying intersections where pedestrian traffic conflicts with vehicle flows
• Detecting recurring congestion patterns linked to nearby events or peak hours
• Understanding how air pollution increases during traffic congestion periods
• Comparing noise levels with crowd activity in entertainment districts
• Identifying abnormal traffic behaviour that may indicate accidents
Video analytics combined with sensor data enables deeper analysis, such as:
• Vehicle speed patterns during congestion
• Crowd formation during public events
• Road incidents detected through abnormal traffic patterns
At this stage, the system answers a deeper question.
Why is this happening?
Instead of reacting blindly to symptoms, city operators begin to understand causes.
Layer 4: Predictive Insights
Anticipating Urban Events Before They Escalate
Once sufficient historical data is accumulated, predictive models can be developed.
Favoriot supports predictive analytics using historical time series data and pattern learning.
Smart Pole systems can begin forecasting urban conditions, such as:
• Predicting traffic congestion before peak hours
• Forecasting air pollution spikes during high traffic periods
• Identifying streets likely to experience accidents based on historical patterns
• Anticipating crowd density during festivals or events
Predictive capabilities allow cities to shift from reactive operations to proactive planning.
Examples of predictive actions include:
• Adjusting traffic signals before congestion builds up
• Activating dynamic street lighting when pedestrian activity increases
• Deploying traffic enforcement in high-risk areas
• Issuing early warnings for environmental conditions
The key question addressed here is:
What may happen next?
Predictive insights help cities think ahead rather than react after problems occur.
Layer 5: Prescriptive Insights
Turning Intelligence Into Action
The final layer of the Favoriot Insight Framework focuses on action.
Insights become valuable only when they trigger the right decisions.
Using Favoriot rule engines, alerts, and automated workflows, Smart Pole systems can trigger operational responses such as:
• Sending alerts to city control centres when accidents are detected
• Automatically increasing street lighting brightness when pedestrian activity rises
• Notifying traffic authorities when abnormal congestion is detected
• Alerting environmental agencies when pollution levels exceed thresholds
• Triggering maintenance alerts when street lights malfunction
Smart Pole data can also support decision makers in long-term planning.
Examples include:
• Identifying areas needing additional pedestrian crossings
• Planning road redesigns for high accident zones
• Improving urban ventilation in pollution hotspots
• Optimising placement of public transportation stops
At this stage, the system answers the most important question.
What should be done?
The result is a city that responds faster, operates smarter, and plans better.

Why Smart Poles Are Important for Modern Cities
Smart Poles transform passive infrastructure into intelligent urban platforms.
They enable cities to:
• Improve road and pedestrian safety
• Gain continuous environmental visibility
• Optimise traffic and mobility systems
• Reduce energy consumption through smart lighting
• Provide digital infrastructure for future smart services
Because Smart Poles leverage existing street infrastructure, they allow cities to deploy sensing networks efficiently without major structural changes.
When integrated with the Favoriot platform, Smart Poles become a scalable foundation for citywide intelligence (Intelligent Poles).

Conclusion
A Smart City cannot rely on isolated sensors or disconnected systems. Urban environments require coordinated intelligence that connects infrastructure, data, and decision-making.
The Smart Pole initiative demonstrates how cities can transform everyday street infrastructure into powerful data-collection and decision-support systems.
Through the structured layers of the Favoriot Insight Framework, cities can move from raw data to actionable intelligence that improves safety, mobility, sustainability, and operational efficiency.
Call to Action
Organisations, city councils, and technology partners interested in exploring Smart Pole deployments using the Favoriot platform are invited to collaborate with us.
Favoriot provides the IoT platform, analytics capabilities, and implementation expertise required to transform urban infrastructure into intelligent city systems.
To learn more about how Smart Pole or Intelligent Pole solutions can be implemented in your city, contact Favoriot and begin the journey from data to decisions.

FAVORIOT Resources
- General
- Pricing
- How to Choose the Right Favoriot Plan for Your IoT Project
- Favoriot Ecosystem Plan
- Why Universities Need an IoT Ecosystem, Not Fragmented IoT Accounts
- When IoT Builders Outgrow Dashboards: Why the Favoriot Platform Developer Plan Exists
- Favoriot Launches Lite Plan to Support Students, Beginners, and Early IoT Builders
- Faybee AI – IoT Copilot
- Favoriot Intelligence
- Favoriot Insight Framework
- What is Favoriot Insight Framework (FIF)?
- Favoriot Machine Learning
- Why Favoriot’s ML Infrastructure Reduces Costs
- Why Favoriot’s Built-in Machine Learning Matters for AI Researchers and IoT Developers
- Favoriot’s Rule Engine 2.0: A Structured Approach to IoT Automation
- The Key Differences: Favoriot’s Rule Engine 2.0 and AI Agents
- IoT & AIoT Labs
- Trainings
- Favoriot Partner Network
- Videos (Playlist & Highlights)
- How-To Use Favoriot Platform Playlist
- Favoriot IoT World Playlist
- IoT Deep Dive Playlist
- Favoriot Sembang Santai Playlist
- IoT Deep Dive – Episode 7 (FAVORIOT Insight Framework)
- IoT Deep Dive – Episode 4 (Favoriot Partner Network Solves IoT Fragmentation)
- IoT Deep Dive – Episode 5 (Building IoT Solutions With Favoriot Middleware)
- Favoriot IoT World – Episode 3 (Unboxing the AIoT Lab)
- Favoriot IoT World – Episode 6 (Favoriot AIoT Architecture – Data to Decision)
- Favoriot IoT World – Episode 4 (Favoriot’s IoT Pricing)
- FULL FAVORIOT RESOURCES
- Others


![[Project Challenge #15] Smart Shopping Behaviour Analytics Using the Favoriot Insight Framework (FIF)](https://iotworld.co/wp-content/uploads/2026/03/Project-Challenge-15-Decoding-Precinct-Shopping-Movement-Patterns.png)
Leave a Reply