![[Project Challenge #3] Mini Weather Station Powered by the Favoriot Insight Framework](https://iotworld.co/wp-content/uploads/2026/03/Mini-Weather-Station-Insight-Framework.png)
Executive Context
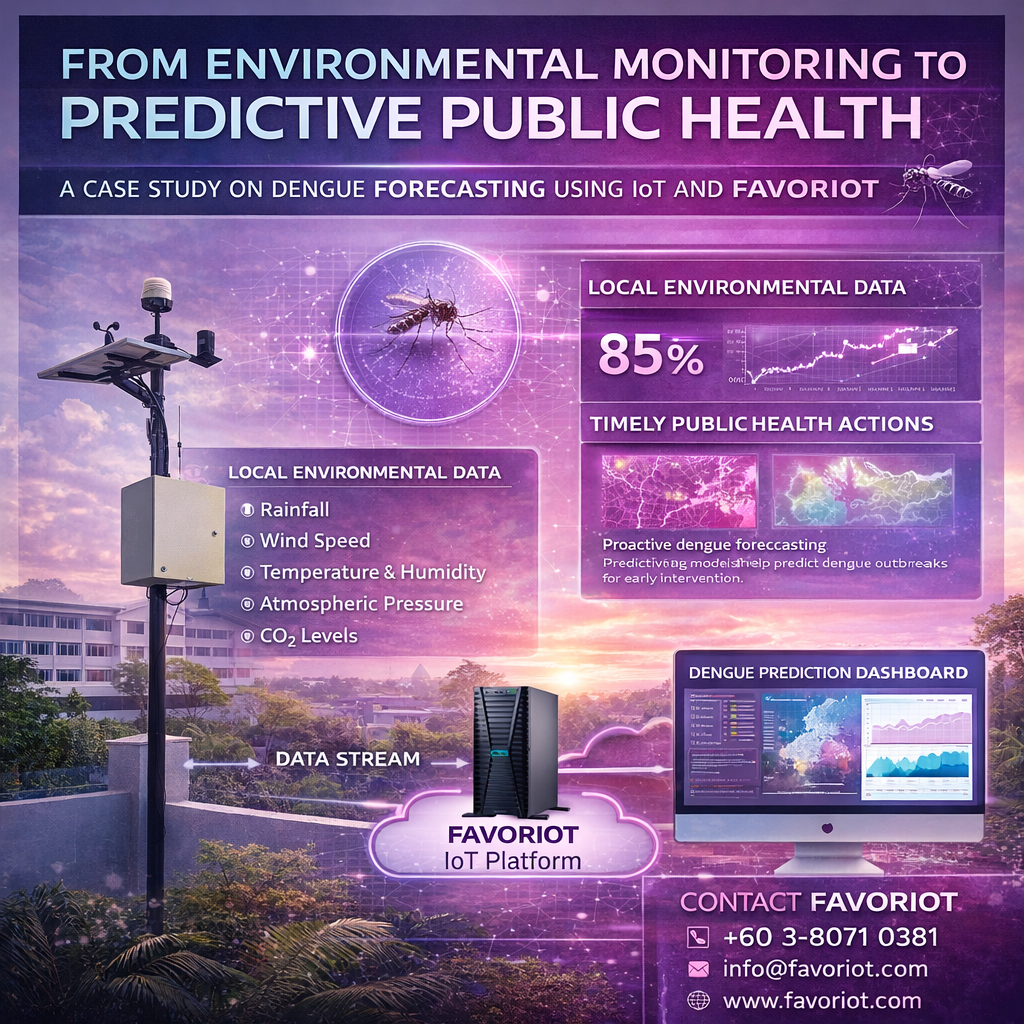
Introduction – From Data Blindness to Urban Awareness
A city does not flood in one dramatic moment.
It begins quietly.
A few millimetres of rain.
A clogged drain.
A rising water level that no one is watching.
By the time the complaint reaches the council, the damage is already done.
Most municipalities rely on periodic inspections, manual reporting, or public complaints to detect environmental risks. Yet climate patterns are becoming less predictable, and response windows are shrinking.
The question is no longer whether cities collect weather data.
The real question is:
Can cities transform environmental data into early action?
A Mini Weather Station, when structured using the Favoriot Insight Framework, becomes more than a sensor deployment. It becomes a real-time decision layer that connects rainfall, wind, temperature, and air quality into operational intelligence.
This is not about monitoring the weather.
It is about strengthening urban resilience.

Layer 0: Intent and Context
Defining Why Data Is Collected
Before deploying hardware, organisations must define purpose and risk.
Key considerations:
- What environmental risks are most critical
- What constitutes normal weather behaviour for this site
- What thresholds indicate danger
- What actions should be triggered when conditions change
Typical objectives for a Mini Weather Station include:
• Flood early warning for municipal areas
• Wind risk monitoring for construction sites
• Air quality protection for schools and communities
• Heat index monitoring for worker safety
• Rain optimisation for precision agriculture
This layer ensures clarity of purpose. Without a defined intent, data has no operational meaning.
Layer 1: Data Foundation
Capturing Environmental Reality
The Mini Weather Station will measure key environmental parameters:
Wind Monitoring
- Wind speed
- Wind direction
- Wind gust intensity
Rain Monitoring
- Rainfall intensity
- Cumulative rainfall
- Rain duration
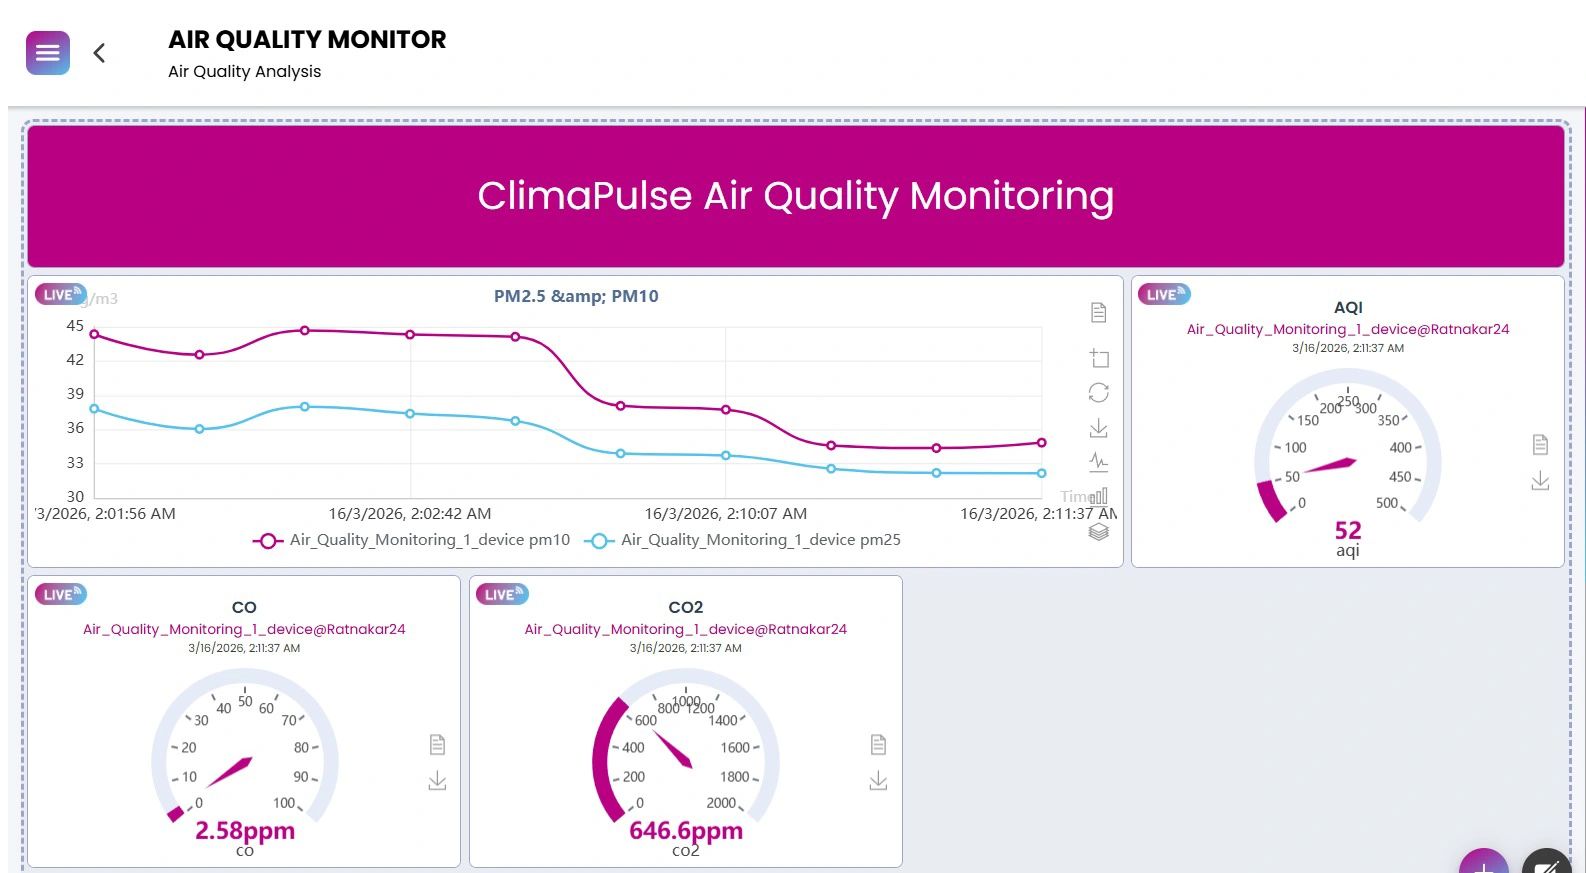
Air Quality Monitoring
- PM2.5
- PM10
- Carbon monoxide
- Nitrogen dioxide
- Ozone
- Calculated Air Quality Index
Core Weather Variables
- Temperature
- Relative humidity
- Atmospheric pressure
- Solar radiation
- UV index
Devices stream telemetry using standard IoT protocols such as MQTT and HTTP through NB-IoT, LoRaWAN, LTE, or WiFi.
Using the Favoriot platform, this layer ensures:
• Secure time-series data storage
• Reliable continuous data ingestion
• Device authentication and lifecycle management
• Structured data for long-term analysis
A strong data foundation is essential because unreliable data leads to unreliable decisions.
Layer 2: Descriptive Insights
Understanding What Is Happening
At this stage, data becomes visible and operationally useful.
The platform provides:
- Real-time dashboards and charts
- Historical trend comparisons
- Multi-parameter visualisation
- Situational awareness across multiple stations
Examples of descriptive insights:
• Rainfall intensity increasing beyond the normal baseline
• Wind gust spikes exceeding safety thresholds
• Air quality index deteriorating over several hours
• Heat index rising during peak afternoon periods
This layer answers the question: What is happening now?
Layer 3: Diagnostic Insights
Understanding Why It Happened
Beyond visibility, organisations need root cause analysis.
Using cross-sensor analytics and pattern comparison, the system can:
- Correlate rainfall and rising water levels
- Compare wind behaviour against historical baselines
- Identify unusual pollutant spikes
- Detect early anomalies in temperature and humidity patterns
This enables the transition from symptoms to causes.
For example:
• Heavy rainfall combined with saturated soil may indicate flood probability
• Wind pattern shifts may signal approaching storm systems
• Persistent particulate concentration increases may indicate nearby emission sources
Diagnostic capability improves understanding and supports informed intervention.
Layer 4: Predictive Insights
Anticipating What May Happen Next
Using historical data, trend modelling, and risk estimation, the platform enables:
- Rainfall forecasting trends
- Flood risk probability estimation
- Air quality deterioration prediction
- Heat stress risk projection
- Wind hazard early warnings
This transforms weather monitoring from reactive observation to proactive planning.
Practical benefits include:
• Early activation of drainage systems
• Advance notification to schools during haze episodes
• Adjustment of construction schedules based on wind forecasts
• Smarter irrigation planning in agricultural estates
Thinking ahead reduces operational disruption and risk exposure.
Layer 5: Prescriptive Insights
Determining What Should Be Done
The final layer converts predictions into recommended action.
Through configurable rule engines and automated workflows, the system can:
- Trigger alerts based on predictive thresholds
- Recommend operational adjustments
- Send notifications via dashboards, email, or Telegram
- Integrate with command centres or external systems through APIs
Examples of prescriptive responses:
• Issue a public advisory when air quality reaches unhealthy levels
• Suspend crane operations during high wind alerts
• Activate flood mitigation pumps during extreme rainfall
• Delay irrigation when rainfall is forecasted
This layer ensures that insights lead to measurable action while keeping human oversight in control.

Strategic Importance of the Mini Weather Station
Climate Resilience
Localised weather intelligence strengthens preparedness against extreme events and reduces vulnerability.
Public Health Protection
Real-time air quality and heat index monitoring protect communities, students, and workers.
Operational Continuity
Construction, agriculture, industrial facilities, and municipal services benefit from predictive environmental intelligence.
Data-Driven Planning
Long-term weather trends support infrastructure planning, sustainability initiatives, and regulatory compliance.
Scalable Smart City Enablement
A single station can scale into a distributed environmental intelligence network across multiple zones, feeding Smart City Command Centres.

Expected Outcomes
By implementing the Mini Weather Station based on the Favoriot Insight Framework, organisations can achieve:
- Continuous environmental visibility
- Faster incident detection
- Reduced environmental risk exposure
- Evidence-based operational decisions
- Structured pathway from data to action
The solution is scalable, secure, and analytics-ready.
Call to Action
Environmental uncertainty demands structured intelligence, not fragmented monitoring.
The Mini Weather Station, powered by the Favoriot Insight Framework, provides a comprehensive pathway from intent to prescriptive action.
Organisations seeking to deploy hyperlocal environmental monitoring for municipalities, campuses, agricultural estates, industrial facilities, or smart township developments are encouraged to contact Favoriot to explore collaboration and implementation strategies.
Favoriot Resources
- FAVORIOT Website
- Try and Register for FREE
- Favoriot Full Documentation
- How to Choose the Right Favoriot Plan for Your IoT Project
- Favoriot Ecosystem Plan
- FAVORIOT’s Faybee: The Little Helper (IoT Copilot) That Makes IoT Feel Less Lonely
- Beyond the Code: How Faybee is Making IoT Development Less Lonely and More Human
- Favoriot Insight Framework
- What is Favoriot Insight Framework (FIF)?
- When IoT Builders Outgrow Dashboards: Why the Favoriot Platform Developer Plan Exists
- Why Universities Need an IoT Ecosystem, Not Fragmented IoT Accounts
- FAVORIOT AIoT Fundamentals & Decision Intelligence
- Mastering AIoT with FAVORIOT: Turning Engineers, Builders, and Thinkers into Practitioners
- Favoriot Launches Lite Plan to Support Students, Beginners, and Early IoT Builders
- Favoriot Machine Learning
- Why Favoriot’s ML Infrastructure Reduces Costs
- Why Favoriot’s Built-in Machine Learning Matters for AI Researchers and IoT Developers
- What Is Favoriot Edge Gateway and How Does It Work?
- Favoriot’s Rule Engine 2.0: A Structured Approach to IoT Automation
- The Key Differences: Favoriot’s Rule Engine 2.0 and AI Agents
- [Infographics] Favoriot AIoT Platform: A 5-Layer Architectural Framework for Scalable, Secure, and Intelligent IoT Deployment
- List of Dr. Mazlan Abbas – Books
- Join Favoriot Partner Network
- Videos (Playlist & Highlights)
- How-To Use Favoriot Platform Playlist
- Favoriot IoT World Playlist
- IoT Deep Dive Playlist
- Favoriot Sembang Santai Playlist
- IoT Deep Dive – Episode 7 (FAVORIOT Insight Framework)
- IoT Deep Dive – Episode 4 (Favoriot Partner Network Solves IoT Fragmentation)
- IoT Deep Dive – Episode 5 (Building IoT Solutions With Favoriot Middleware)
- Favoriot IoT World – Episode 3 (Unboxing the AIoT Lab)
- Favoriot IoT World – Episode 6 (Favoriot AIoT Architecture – Data to Decision)
- Favoriot IoT World – Episode 4 (Favoriot’s IoT Pricing)
- FULL FAVORIOT RESOURCES


![[Project Challenge #15] Smart Shopping Behaviour Analytics Using the Favoriot Insight Framework (FIF)](https://iotworld.co/wp-content/uploads/2026/03/Project-Challenge-15-Decoding-Precinct-Shopping-Movement-Patterns.png)
Leave a Reply