
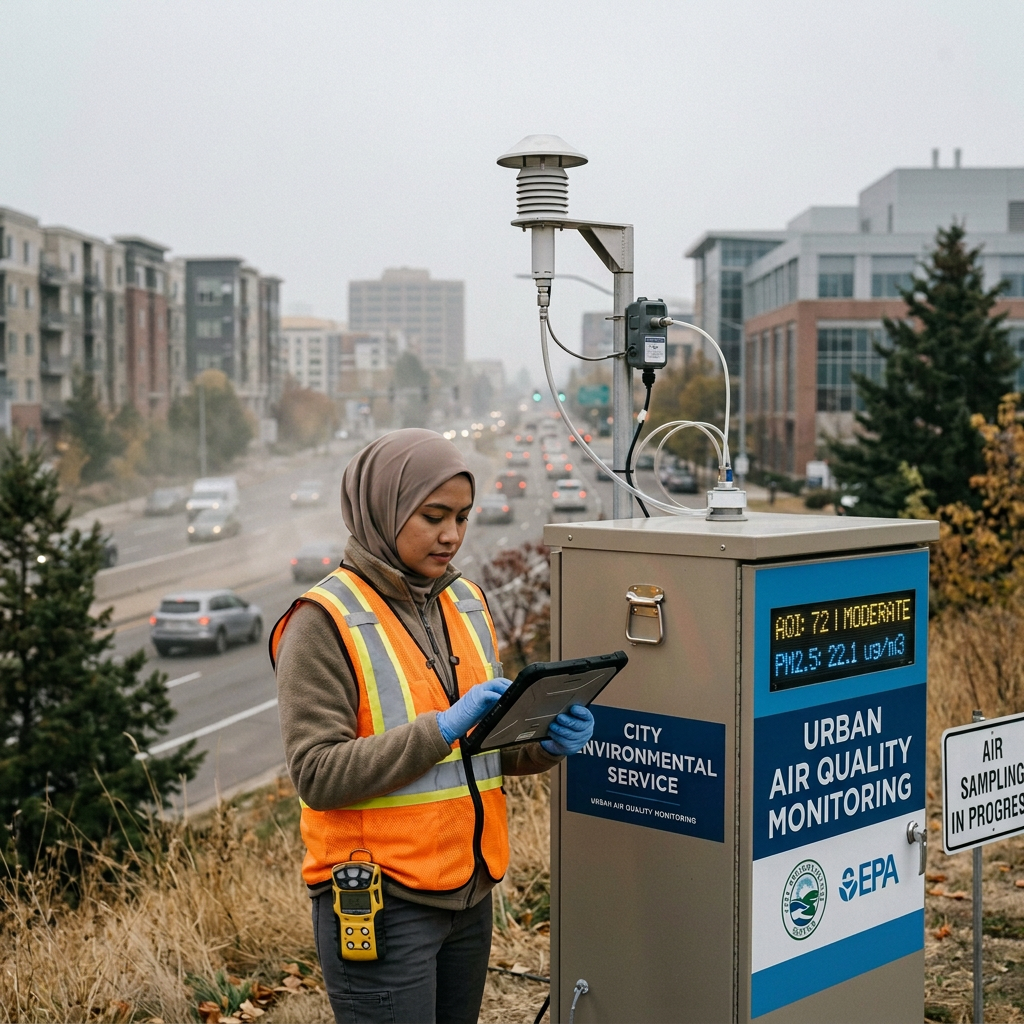
Your Air, Your Data: A Plan to Crowdsource Air Quality Across Malaysia
You don’t need a government budget or a national sensor network to know what you’re breathing. You need a plan, a handful of low-cost sensors, and a platform that turns scattered readings into a living map. Here’s exactly how.
Every haze season, the same question resurfaces in group chats, news comments, and parent WhatsApp groups across Malaysia: how bad is the air right now, exactly where I am? The Department of Environment’s official stations are accurate, but they are also few, and they measure the air over a wide radius — not the air outside your school, your factory floor, or your kampung.
That gap between “official average” and “what I’m actually breathing” is a small, local version of the same problem we see everywhere in IoT: data exists somewhere, but not where the decision needs to be made. We call this operational blindness — and air quality is one of the clearest, most personal examples of it.
“You don’t fix operational blindness with more dashboards at head office. You fix it by putting a sensor exactly where the question is being asked — and making sure the answer reaches the person who asked it.”
— Dr. Mazlan Abbas, CEO, Favoriot
The good news is that closing this gap no longer requires a research grant or a telco partnership. A single Favoriot Developer Plan account, a network of community-built sensor nodes, and a weekend of setup is enough to start. This post gives you the complete plan — the same one we’d hand a university lab, a state environmental office, or a group of concerned residents who just want to know.
Why This Plan, Why NowCrowdsourcing Is the Missing Layer
Government monitoring answers “what is the air quality in this region.” Crowdsourced monitoring answers “what is the air quality right here, right now” — block by block, school by school, industrial zone by industrial zone. Neither replaces the other. Together, they turn a single national number into a map anyone can act on.
The Favoriot Developer Plan is built for exactly this kind of distributed project: unlimited devices, up to 500,000 API calls a day, unlimited public and private dashboards, and — critically — unlimited customer sub-accounts, so every volunteer, school, or partner agency can have their own login without you managing a spreadsheet of credentials.
“A platform’s job is to disappear behind the outcome. If your volunteers are thinking about the API, we’ve failed. They should only be thinking about the air.”
— Dr. Mazlan Abbas, CEO, Favoriot
The PlanNine Steps, From Idea to Live Map
-
Define your coverage and your “why”
Pick a scope you can realistically seed with 10–30 nodes first: a district, a school cluster, an industrial corridor, or a handful of towns known for haze exposure. Write down the one decision this data should help someone make — that becomes your dashboard’s headline later.
Week 1 -
Sign up for the Favoriot Developer Plan
This tier gives you the headroom a multi-node, multi-volunteer project actually needs: unlimited devices, 500,000 daily API calls, data import/export, and unlimited customer accounts so each contributor gets their own restricted access without touching your main account.
Platform setup -
Choose and build your sensor node
A dependable, low-cost build: an ESP32 microcontroller, a PMS5003 or SDS011 laser particle sensor for PM2.5/PM10, and optionally an MQ135 for general air quality and a BME280 for temperature and humidity. Total cost is typically under RM250 per node — well within reach for a school club or RT/RW community group.
Hardware -
Register your device profile and data structure
In the Favoriot Platform, create a device profile once — fields for PM2.5, PM10, temperature, humidity, latitude, and longitude — then reuse it for every node. Consistent structure now is what makes state-wide comparison possible later.
Data modelling -
Send readings over HTTP or MQTT
Each ESP32 node posts a JSON reading to the Favoriot Data API every 1–5 minutes. With unlimited devices and 500,000 daily calls on the Developer Plan, you can scale from 10 nodes to several hundred without renegotiating your plan.
Ingestion -
Onboard volunteers with their own customer accounts
Give each school, community group, or partner agency a designated customer account. They see only their own node and history; you retain the full statewide view. This is what lets a crowdsourced project scale past “one person’s passion project.”
Community -
Build the public map dashboard
Use the Map widget to plot every node as a live, colour-coded pin — green, yellow, red — the same visual language people already know from the Air Pollutant Index. Add Graph and Card widgets so anyone can drill into a single station’s trend over the last 24 hours.
Visualisation -
Set alert thresholds people can actually use
Configure the Rules Engine to trigger a Telegram or email alert when any node crosses an unhealthy threshold. A parent-teacher group, a factory safety officer, or a clinic can now react in minutes instead of finding out from the evening news.
Automation -
Forecast, correlate, and share the findings
With the Developer Plan’s analytics dashboards and time-series forecasting models, correlate PM2.5 spikes with wind direction, hotspot burning season, or traffic hours. Use HTTP Post forwarding to share a clean data feed with a university partner, a state DOE office, or your own ESG report — no manual exports needed.
Insight
Why the Developer Plan specifically
A crowdsourced project lives or dies on three things this tier is built for:
- Unlimited devices — start with 10 nodes, grow to 500 without a plan change.
- Unlimited customer accounts — every volunteer or partner gets safe, scoped access.
- Forecasting & HTTP Post forwarding — turn raw readings into predictions, and hand a clean feed to the agencies who need it.
“The best air quality project isn’t the one with the fanciest sensor. It’s the one that’s still running, with more volunteers, a year from now.”
— Dr. Mazlan Abbas, CEO, Favoriot
What You’ll HaveAt the End of the First Month
A live map, refreshed every few minutes, showing real air quality across every neighbourhood you’ve reached — not modelled, not estimated, but measured by people who live there. A group of volunteers who feel ownership over a problem they used to just complain about. And a dataset clean enough to hand to a researcher, a reporter, or a regulator, because you built the structure right from step four.
None of this requires you to be an IoT engineer. It requires a plan, a first ten nodes, and a platform that scales quietly in the background while you focus on the community in front of you. That’s the part Favoriot is built to handle — so you don’t have to.
Ready to put your first sensor on the map?
Start with the Favoriot Developer Plan and turn your community’s curiosity about the air into a dataset the whole region can use.


Leave a Reply