
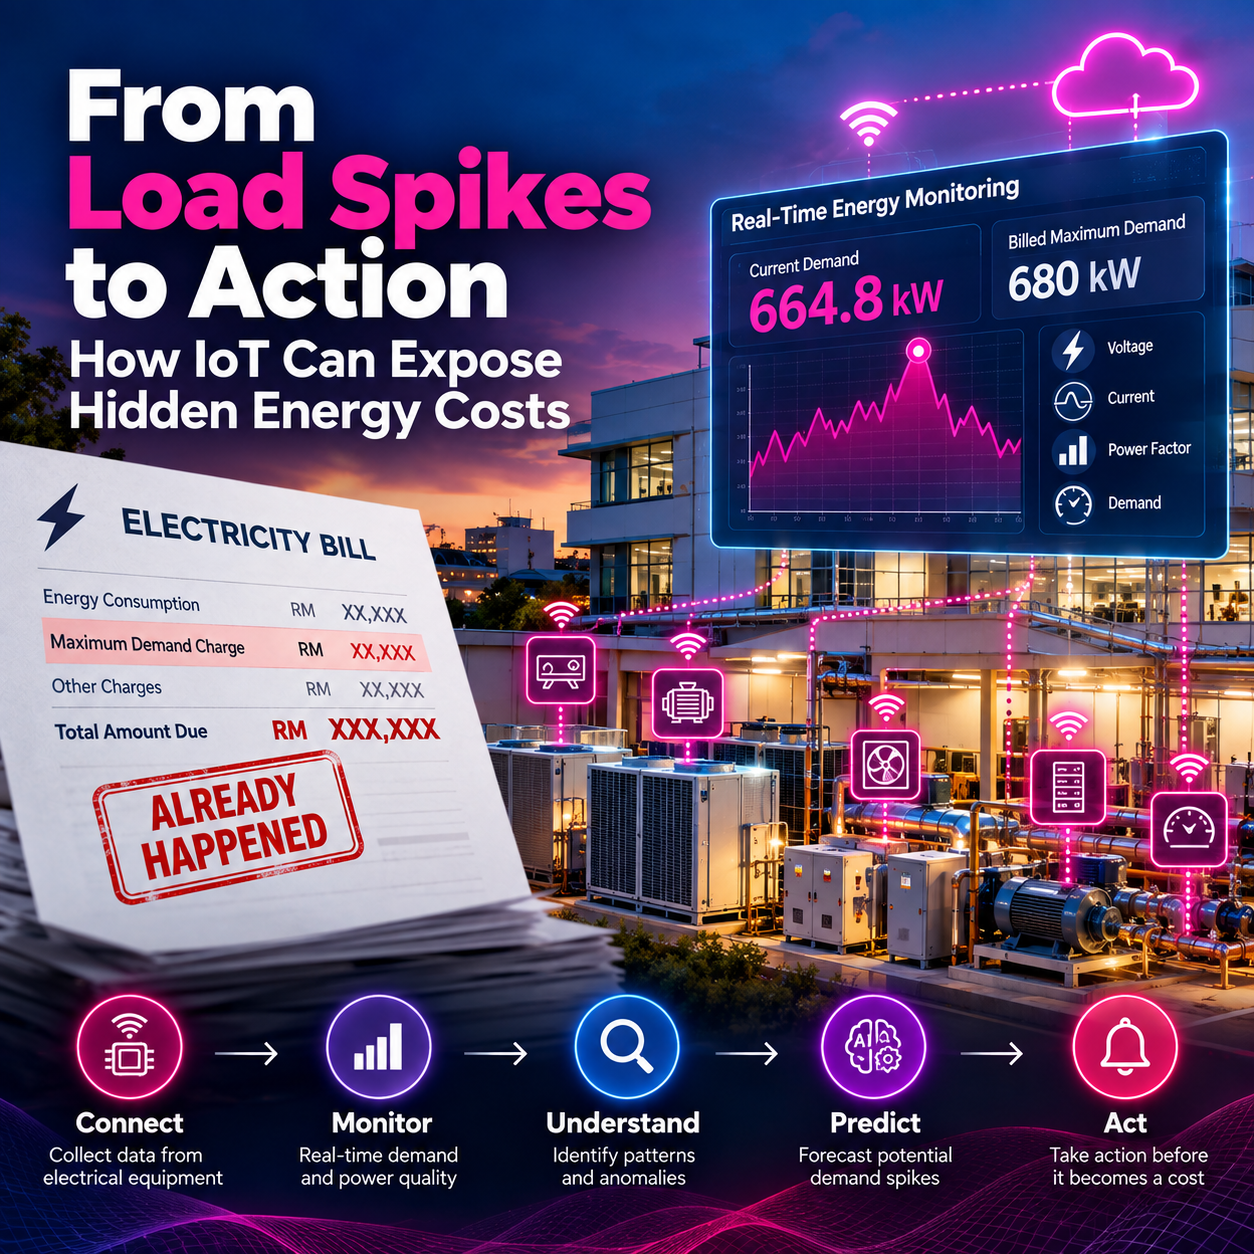
Energy management is often treated as a reporting problem. Organisations receive electricity bills, analyse historical consumption and compare monthly figures. While this information remains useful, it has one major limitation: it describes events that have already happened.
For facilities affected by Maximum Demand charges, that delay can become expensive. A short period of unusually high electrical demand can affect costs, yet facility operators may have limited visibility into the event while it is occurring.
This is where real-time IoT monitoring changes the operational model.
Understanding the Visibility Gap
Consider a facility containing air-conditioning systems, computers, motors, laboratory equipment and other electrical loads. Demand changes throughout the day as equipment switches on and operating conditions change.
Traditional monthly reporting can answer, “What did we consume?”
Real-time monitoring can answer a different question: “What is happening right now?”
That distinction matters because operational action can only occur when information reaches the right people early enough.
Building a Real-Time Maximum Demand Monitoring System
A practical IoT architecture can continuously capture parameters including voltage, current, power factor and electrical demand. Measurements can be collected through a power quality analyser, transmitted using an industrial communication protocol such as RS-485 Modbus RTU, processed by an edge microcontroller and forwarded to a cloud-based IoT environment.
Once connected, the data can support:
- Real-time Maximum Demand monitoring
- Detection of sudden load increases
- Historical trend analysis
- Threshold-based alerts
- Comparison of operating periods
- Earlier intervention by facility personnel
In one real-world deployment, the monitoring system recorded a peak of 664.8 kW, closely tracking a 680 kW Maximum Demand value used for billing.
The result shows how relatively accessible IoT technologies can provide useful visibility into a significant operational parameter.
Moving Beyond Dashboards
A common mistake in IoT projects is treating the dashboard as the final outcome. A dashboard is only the interface through which operational information becomes visible.
The more meaningful question is whether the system helps people make better decisions.
An energy monitoring system should help operators understand when demand normally peaks, identify unusual consumption behaviour and recognise conditions that may require intervention.
This shifts IoT from passive data collection towards operational awareness.
Adding Intelligence to Historical Data
Continuous monitoring also creates something valuable over time: an operational history.
Machine learning models could analyse this historical information to identify recurring demand patterns, detect unusual energy behaviour, forecast periods of elevated demand and provide earlier warnings of possible demand spikes.
The architecture then progresses through several stages:
Connect → Monitor → Understand → Predict → Act
The same principle extends beyond electricity. Similar architectures can monitor HVAC performance, water consumption, generators, renewable-energy systems, industrial equipment and other assets.
The broader lesson is simple. IoT becomes useful when information that was previously hidden becomes visible early enough for somebody to do something about it.
[Note: This is one of Favoriot‘s Use Case – Energy Monitoring]


Leave a Reply