
When evaluating an IoT deployment, four questions can reveal more than a long list of technical specifications: What problem was solved? How was it deployed? What changed for the customer? Did it reduce operational effort or cost?
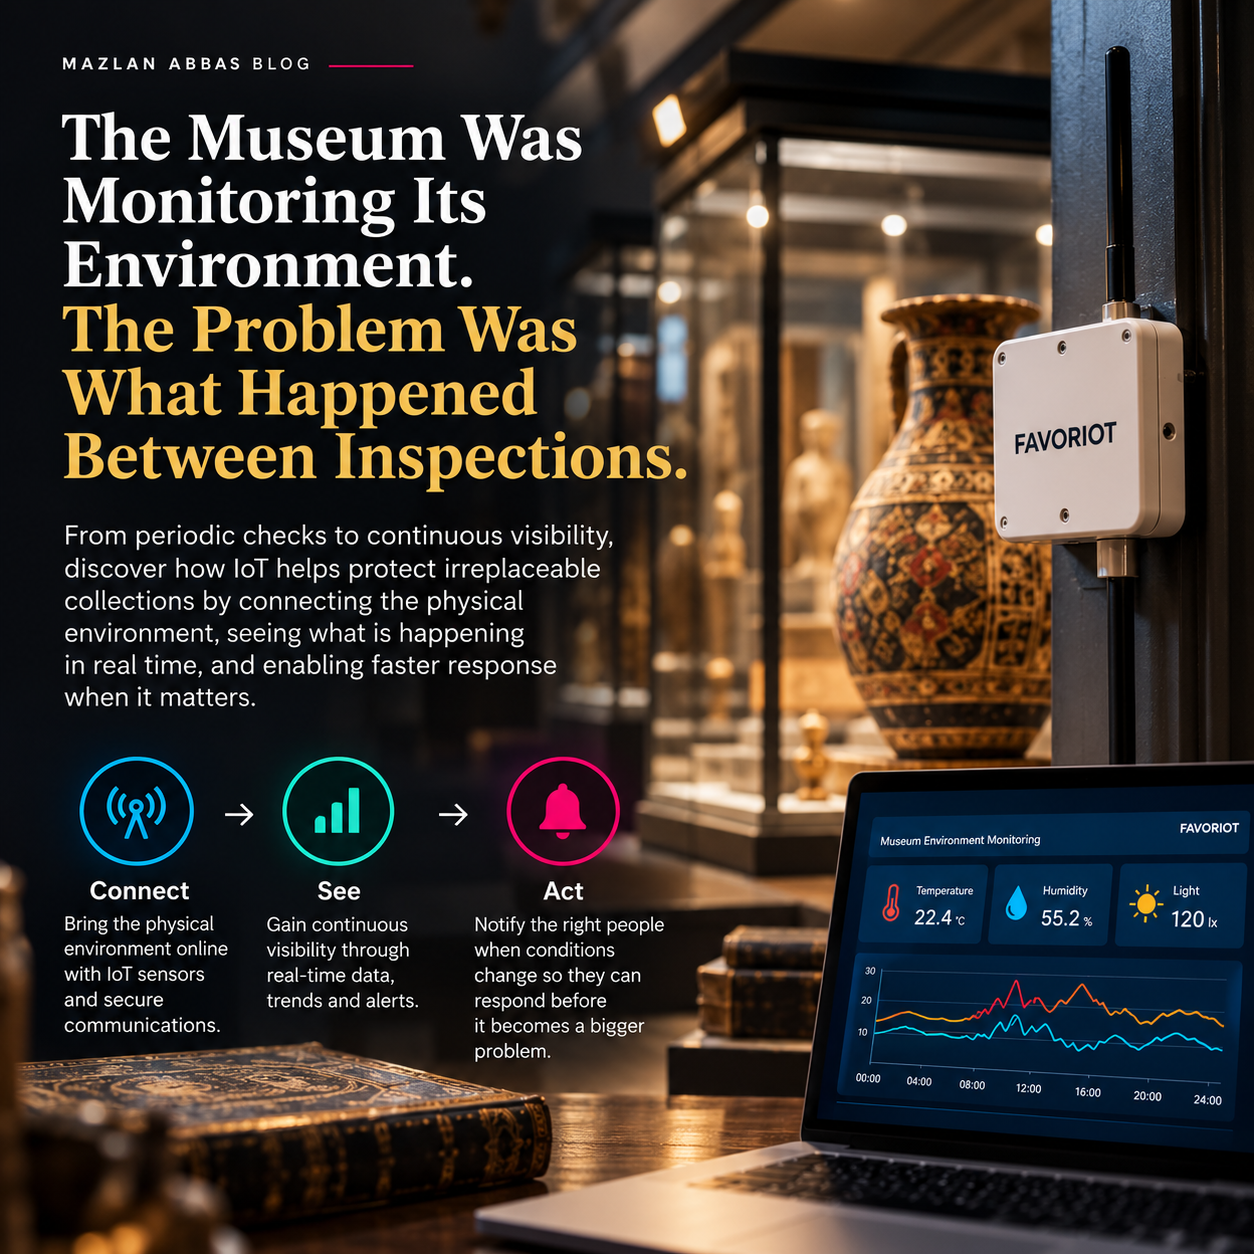
A national museum environmental monitoring project provides a useful example. The museum needed to maintain appropriate temperature, humidity and light conditions within storage areas containing sensitive and irreplaceable collections.
Environmental monitoring was already taking place, but it depended on scheduled manual inspections. Each inspection provided a reading at a particular moment. What happened during the hours between those readings was much harder to know.
The Problem Was the Gap Between Observations
Manual monitoring created several weaknesses. Environmental conditions could move outside acceptable ranges between inspections. Staff would not immediately know that something had changed, continuous trends were difficult to observe, and historical records depended heavily on manually collected information.
The requirement was therefore not simply to replace an instrument with a sensor. It was to move from periodic observation to continuous awareness.
That difference is relevant to many IoT projects. Organisations may already collect operational information. Their real problem is that the information arrives too late, remains incomplete or does not reach the person who needs it.
Deployment Without Unnecessary Complexity
The project focused on temperature, relative humidity and light. LoRa sensor nodes collected environmental readings and transmitted them to a gateway. From there, a cellular connection carried the information to the FAVORIOT Platform.
The platform stored the readings, displayed current conditions and historical trends, and continuously checked incoming information against configured thresholds. When conditions moved outside those thresholds, notifications could be sent to designated personnel.
The exact deployment duration was not documented. What is clear is that the architecture reduced several potential deployment complications. Wireless communications reduced cabling requirements, while the cellular uplink allowed the initial system to operate without depending on the museum’s internal network.
What Changed After Deployment?
The customer moved from manual environmental checks to 24/7 automated monitoring. Three important environmental parameters could be monitored continuously, while abnormal conditions could trigger notifications in less than 60 seconds.
There was another significant change. Every environmental reading and alert event could become part of a digital, time-stamped history. This gave staff the ability to examine what happened before, during and after an abnormal event rather than relying solely on individual observations.
Manual inspection rounds were also no longer required specifically for environmental data capture. Human attention could shift from routinely collecting information toward responding when the information indicated that something required attention.
Where Were the Savings?
No monetary cost-saving figure was documented for the project, so calculating an ROI from the available information would require assumptions.
The operational savings are easier to identify. Routine manual data collection was reduced, significant new cabling was avoided, and the initial deployment did not require dependence on the museum’s internal network infrastructure.
There is also a less easily quantified benefit: earlier awareness. For a museum protecting irreplaceable objects, detecting an environmental problem quickly may matter far more than the cost of collecting a reading manually.
Connect • See • Act™
The project illustrates three stages that can be applied to many IoT deployments.
Connect brings the physical environment online. See converts sensor readings into continuous awareness, trends and exceptions. Act ensures that abnormal conditions reach people who can respond.
The final stage is what gives the first two stages meaning. Connecting thousands of devices does not automatically create operational value, and neither does building an attractive dashboard.
The value appears when better visibility changes what people can do, how quickly they can respond and how much routine work they no longer need to perform.
[Note: Favoriot Use Case – Museum Environmental Monitoring]


Leave a Reply